Introduction
Welcome, innovative tech minds! Are you gearing up to tame the beast that is Docker with Xdebug? Brace yourself because you’re about to embark on a journey toward seamless debugging in multi-stage Docker environments. With this guide, you’ll set up Xdebug like a pro, paving the way for unruffled coding experiences.
What is Xdebug and Why Use It?
In the wilds of coding, Xdebug stands as a beacon of hope. It’s not just debugging; it’s about understanding the inner workings of your PHP scripts. With Xdebug, you can step through your code, inspect variables, and more. When used with Docker, it empowers you to maintain the performance while keeping an eye on potential issues.
Configuring for Peak Performance
The union of Docker and Xdebug is like a dance—it requires rhythm and the right moves. Here’s how you lead:
Mastering the Dockerfile
Your Dockerfile isn’t only a script; it’s a blueprint for your application’s runtime environment. Observing the right conventions is the key to a robust setup. Behold, your Docker blueprint:
					# path: .docker/Dockerfile

FROM php:8.2-fpm-buster as base

FROM base as dev

RUN set -e ; \
    pecl install xdebug-3.2.2; \
    docker-php-ext-enable xdebug;

# copy xdebug settings
COPY .docker/php/xdebug.ini /usr/local/etc/php/conf.d/docker-php-ext-xdebug.ini

# discover script
COPY .docker/scripts/xdebug-discover-host.sh /usr/local/bin/
We start with a common PHP base image, install Xdebug, then ensure its settings are copied over. Notice the second stage named ‘prod’? That’s where we disable Xdebug because, in production, performance is king.
Details in .docker/php/xdebug.ini
Now, for a deep dive into the xdebug.ini file. It’s crucial—it tells Xdebug how to behave.
					# path: .docker/php/xdebug.ini

zend_extension=xdebug.so
xdebug.mode=${XDEBUG_MODE}
xdebug.client_host=${XDEBUG_CLIENT_HOST}
xdebug.client_port=${XDEBUG_CLIENT_PORT}
xdebug.start_with_request=${XDEBUG_START_WITH_REQUEST}
xdebug.idekey=${XDEBUG_IDEKEY}
xdebug.discover_client_host=false
xdebug.output_dir=/var/www/data/xdebug
xdebug.profiler_output_name=cachegrind.out.%t.%s.%H
Each directive has a purpose—setting the mode, defining where to send the output, and others. It’s tailored for precise control.
Multi-Stage Dockerfile Full Breakdown
Your Dockerfile should mirror the stages of your application’s lifecycle, from development to production:
					# path: .docker/Dockerfile

FROM base as ci

ENV XDEBUG_MODE=off
For CI, we’ve switched off Xdebug (notice the ENV XDEBUG_MODE=off). It’s all about adjusting each environment’s settings to get that sweet spot of efficiency and functionality.
Setting up the .env file by environment
One key aspect of managing configurations in Docker environments is the utilization of .env files. They serve as a manifest for environment variables, effectively separating configuration from code. Different environments require different settings, and that’s where .env files shine. Let’s break down the significance of each of these files:
.env.integration
The .env.integration file is crafted for your integration environment. Here’s the essence:
					# path: .env.integration
XDEBUG_MODE=off
During integration testing, you want performance, not internal insights, hence Xdebug is switched off. If you do need Xdebug for coverage reports, you’d set it to coverage instead of off.
.env.local
Your local environment is your sandbox. With .env.local, you’re setting up Xdebug to communicate with your IDE:
					# path: .env.local

XDEBUG_MODE=off
XDEBUG_CLIENT_HOST=172.21.0.1
XDEBUG_CLIENT_PORT=9100
XDEBUG_IDEKEY=PHPSTORM
XDEBUG_START_WITH_REQUEST=yes
Here we have a diverse configuration. While Xdebug is off by default, the setup is primed for debugging when you’re ready to inspect your code. You’ve got the host, port, IDE key—all you need for Xdebug to hold a conversation with your IDE, like PHPStorm.
.env.production
In production, .env.production keeps it simple:
					# path: .env.production

XDEBUG_MODE=off
No Xdebug here—performance is the priority, and you want minimal overhead.
.env.staging
Staging mirrors production, but it’s also your dress rehearsal zone. The .env.staging configurations reflect this:
					# path: .env.staging

XDEBUG_MODE=off
It’s an echo of production—Xdebug is off but ready to be enabled if you need some last-minute profiling.
With these .env files, remember to restart your Docker containers upon changing Xdebug settings. They won’t take effect until you do. And if you’re ever uncertain about your XDEBUG_CLIENT_HOST, a quick run of the command:
					# shell

make xdebug-discover-host
This will configure automatically the right IP address for your configuration. Especially helpfull if you are using
Mastering the art of these environment-specific settings propels your development practices into a realm of precision and control. Whether it’s integration, local development, staging, or production, every environment gets the settings it deserves with .env files.
Integrating GitHub Workflow
Integrating Xdebug with your GitHub workflows streamlines your continuous integration process. It looks something like this:
					# path: github/workflows/unit-tests.yml

  unit-tests:
    name: Unit tests
    runs-on: ubuntu-20.04
    steps:
      - name: Run Unit tests
        run: |
          docker run \
            -e XDEBUG_MODE=coverage \
            php vendor/bin/phpunit \
            -c phpunit.xml.dist
This script sets up an environment right on GitHub’s servers to run your tests automatically. It ensures nothing slips through the cracks.
Automating with Makefile Commands
Your Makefile is a vital cog in the machine—it orchestrates how your application is built and tested. Behold, the power in a Makefile:
					# path: Makefile
composer-install:
  $(EXEC_PHP) php -d 'xdebug.mode=off' /usr/bin/composer install --no-scripts

composer-update:
	$(EXEC_PHP) php -d 'xdebug.mode=off' /usr/bin/composer update

composer-dump-autoload:
	$(EXEC_PHP) php -d 'xdebug.mode=off' /usr/bin/composer dump-autoload

composer-dump-autoload-optimize:
	$(EXEC_PHP) php -d 'xdebug.mode=off' /usr/bin/composer dump-autoload -a

composer-update-lock:
	$(EXEC_PHP) php -d 'xdebug.mode=off' /usr/bin/composer update --lock

xdebug-discover-host:
    $(EXEC_PHP) bash xdebug-discover-host.sh

xdebug-clear:
	$(EXEC_PHP) bash -c "rm -rf /var/www/data/xdebug/cachegrind*"
With these snippets, we tell Composer to gracefully yield to our strict Xdebug settings. Further, the xdebug-discover-host pulls its weight by automating host IP discovery.
Unearthing Host IPs with xdebug-discover-host.sh
Ever felt lost choosing the XDEBUG_CLIENT_HOST ? This script has got your back:
					# path: .docker/scripts/xdebug-discover-host.sh

#!/usr/bin/env bash
set -e

HOST=host.docker.internal

if ! ping -c 1 "${HOST}" >/dev/null 2>&1 ; then
    HOST=$(ip route | awk '/default/ { print $3 }')
fi

echo "HOST: $HOST"

if [ -f .env ]; then
  sed -i "s/XDEBUG_CLIENT_HOST=.*/XDEBUG_CLIENT_HOST=$HOST/" .env
fi
This script simplifies your setup. Run it and watch your `.env` file update itself with the correct host.
Configure PhpStorm
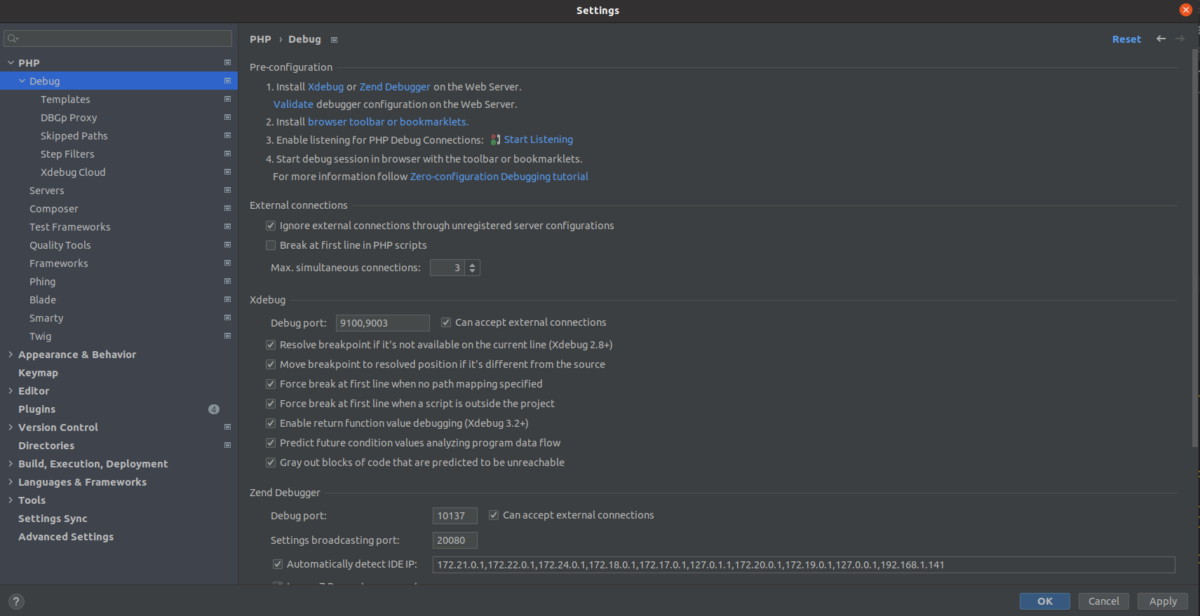
In my case, I configure xdebug to work with port 9100 but the default for it is 9003.
Conclusion and Next Steps
With this hefty guide, you’re now armed to the teeth with knowledge and examples. Set up Xdebug in your Docker environment, and raise your developer flag high! Should you desire a custom fit or hit any snags, our consulting services in API, PHP, DevOps, and others are at your disposal. Let’s elevate your Docker strategy to the highest level!
References
The information provided here is sourced from the Official Xdebug documentation, Docker official documentation, coupled with a generous sprinkle of hands-on experience.
Chomping at the bit to refine your Docker workflows with Xdebug? Get in touch, and together, we’ll turn potential into excellence.